
- Data analyst resume writing is framed as data storytelling: Turn “raw data” duties into clear insights with metrics so a recruiter can see value in seconds.
- Recruiters pattern-match fast using four signals: Keyword alignment, measurable impact, business problem-solving context, and a clean organized tech stack instead of a “keyword salad.”
- ATS is the first technical hurdle: Single-column layout, no text boxes or skill bars, standard headings, and clean formatting prevent parsing errors that scramble your resume.
- The structure runs like a pipeline: Metadata header with portfolio links, an executive-dashboard summary, a curated skills stack, and experience bullets using “Action Verb + Project + Metric.”
- Projects are positioned as the secret weapon, especially for juniors and career changers: Treat each project like a mini case study with tools, scale, results, and links, then refine with quantification, common-mistake checks, and role-level tailoring.
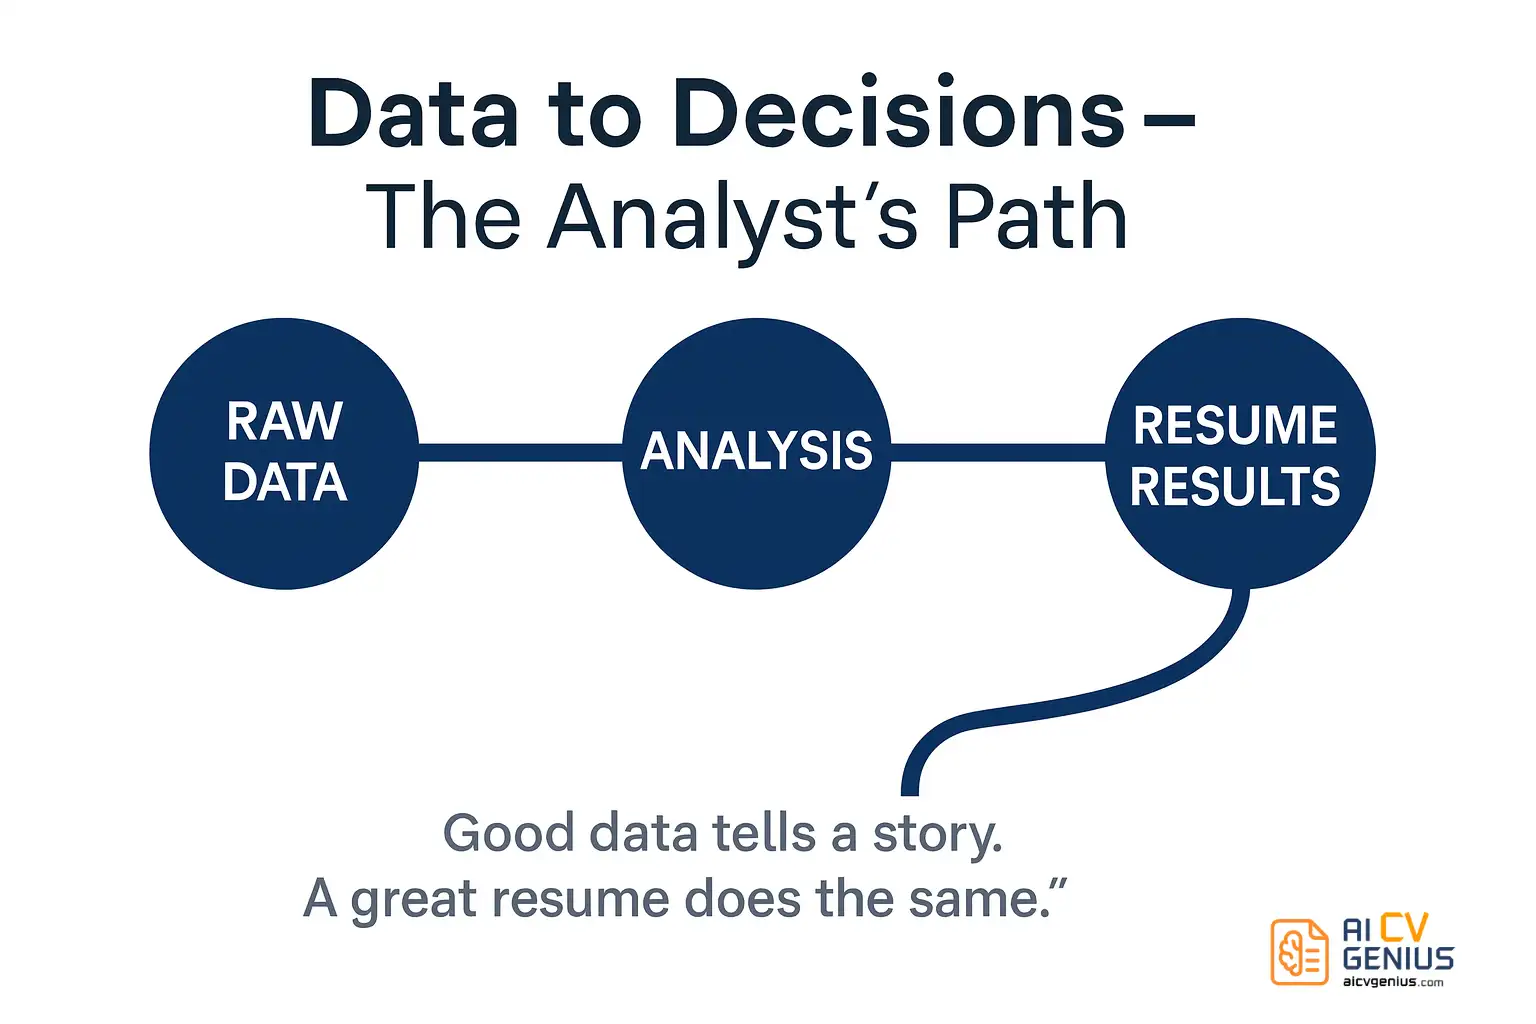
When your job is to work with data, your core function is to find a hidden story and tell it with clarity. Writing a data analyst resume follows the exact same principle. You must turn a raw dataset – your career history – into a compelling insight for the hiring manager.
A recruiter should be able to scan your resume and understand, in seconds, the value you create. The problem is, most data analyst resumes fail not because the candidates lack skills, but because they bury their achievements under a mountain of jargon and vague responsibilities. They present the raw data (“Responsible for reports”) but never the insight (“Automated reports, saving 10 hours per week”). This guide will teach you how to build a data analyst resume that balances logic, structure, and powerful storytelling. We will transform your experience from a simple logfile into an executive-level dashboard that drives one clear decision: “We need to interview this person.”
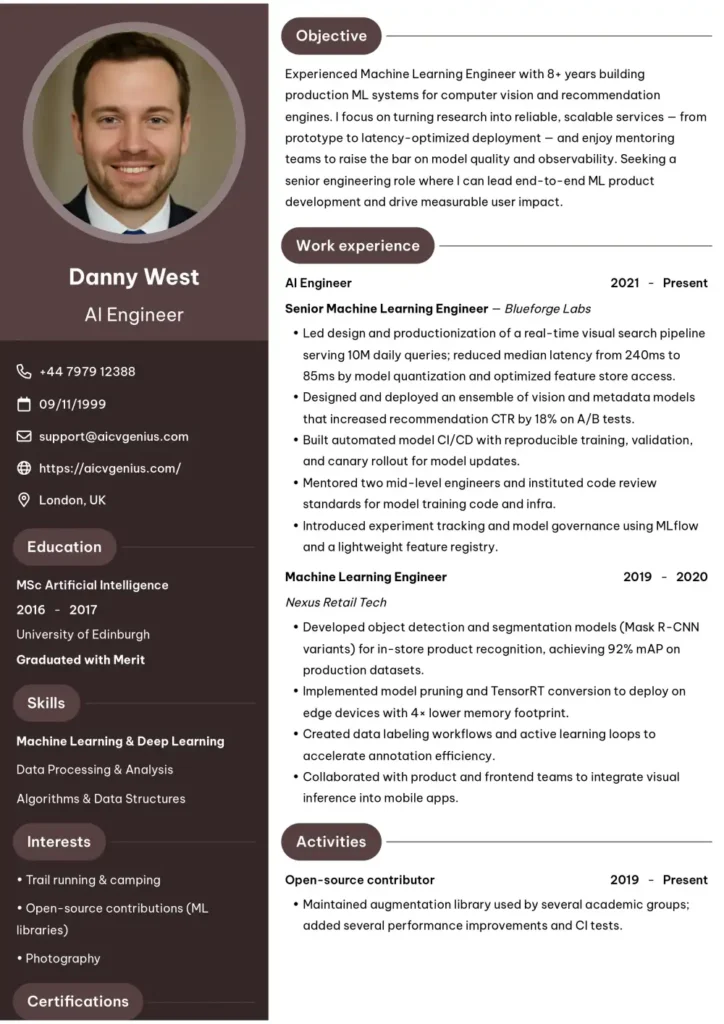
The Recruiter’s Query: What They Really Look For
Hiring managers and recruiters are analysts, too. They run a mental query against your resume, looking for signals that predict success. In their 7-second scan, they are not reading; they are pattern-matching. Here is the query they are running:
- Signal 1: Keyword Alignment (The `JOIN`): Does the headline (e.g., “Data Analyst,” “Business Intelligence Analyst”) match the job title? Do the listed tools (SQL, Power BI, Python) match the “required” section of the job description? This is the first filter.
- Signal 2: Measurable Impact (The `SUM()`): Do they see numbers? Recruiters are trained to hunt for percentages, dollar amounts, and time saved. “Increased efficiency by 28%” is a signal. “Improved reports” is just noise.
- Signal 3: Business Acumen (The `CASE` Statement): Does the candidate just use tools, or do they solve problems with them? “Wrote SQL queries” is a task. “Wrote SQL queries to identify customer churn drivers” is a solution.
- Signal 4: Technical Fluency (The `GROUP BY`): Are the skills organized logically? Or is it a “keyword salad” of every tool they’ve ever touched? They want to see a clean, organized technical stack.
Think of your resume as the result of a query. Every bullet point is a SELECT statement returning one clear, compelling result: what you achieved.
The ATS Filter: Your First Technical Challenge
Before a human ever sees your resume, you must pass a machine. The Applicant Tracking System (ATS) is your first technical hurdle. This software doesn’t “read” your resume; it parses it for keywords and structure. A poorly formatted resume is like a corrupted data file – the system fails to read it and simply moves on. Here is how data analysts fail the ATS test:
- The Two-Column Layout: This is the #1 resume killer. An ATS reads from left to right, top to bottom. It will read the left column, then the right, mixing your job titles with your skills, creating nonsense. Always use a single-column format.
- Skill Bars and Graphics: Those visual skill bars (e.g., “Python: 4/5 stars”) are unreadable by an ATS and look amateurish to a human. Prove your skill with a project, not a graphic.
- Text Boxes: Any text placed inside a text box is often invisible to the parsing algorithm.
- Uncommon Headings: Stick to standard headings like “Professional Experience,” “Skills,” and “Education.” A creative heading like “Where I’ve Made an Impact” will be skipped.
- Special Characters: Be careful with how you list tools. While “Python” is safe, something like “C++” can sometimes cause parsing errors. It’s best to write it out or stick to tools that are purely text.
Your resume’s design should be invisible. Its only job is to present the data (your experience) in the cleanest, most parsable format possible.
Structure: Your Resume as a Data Pipeline
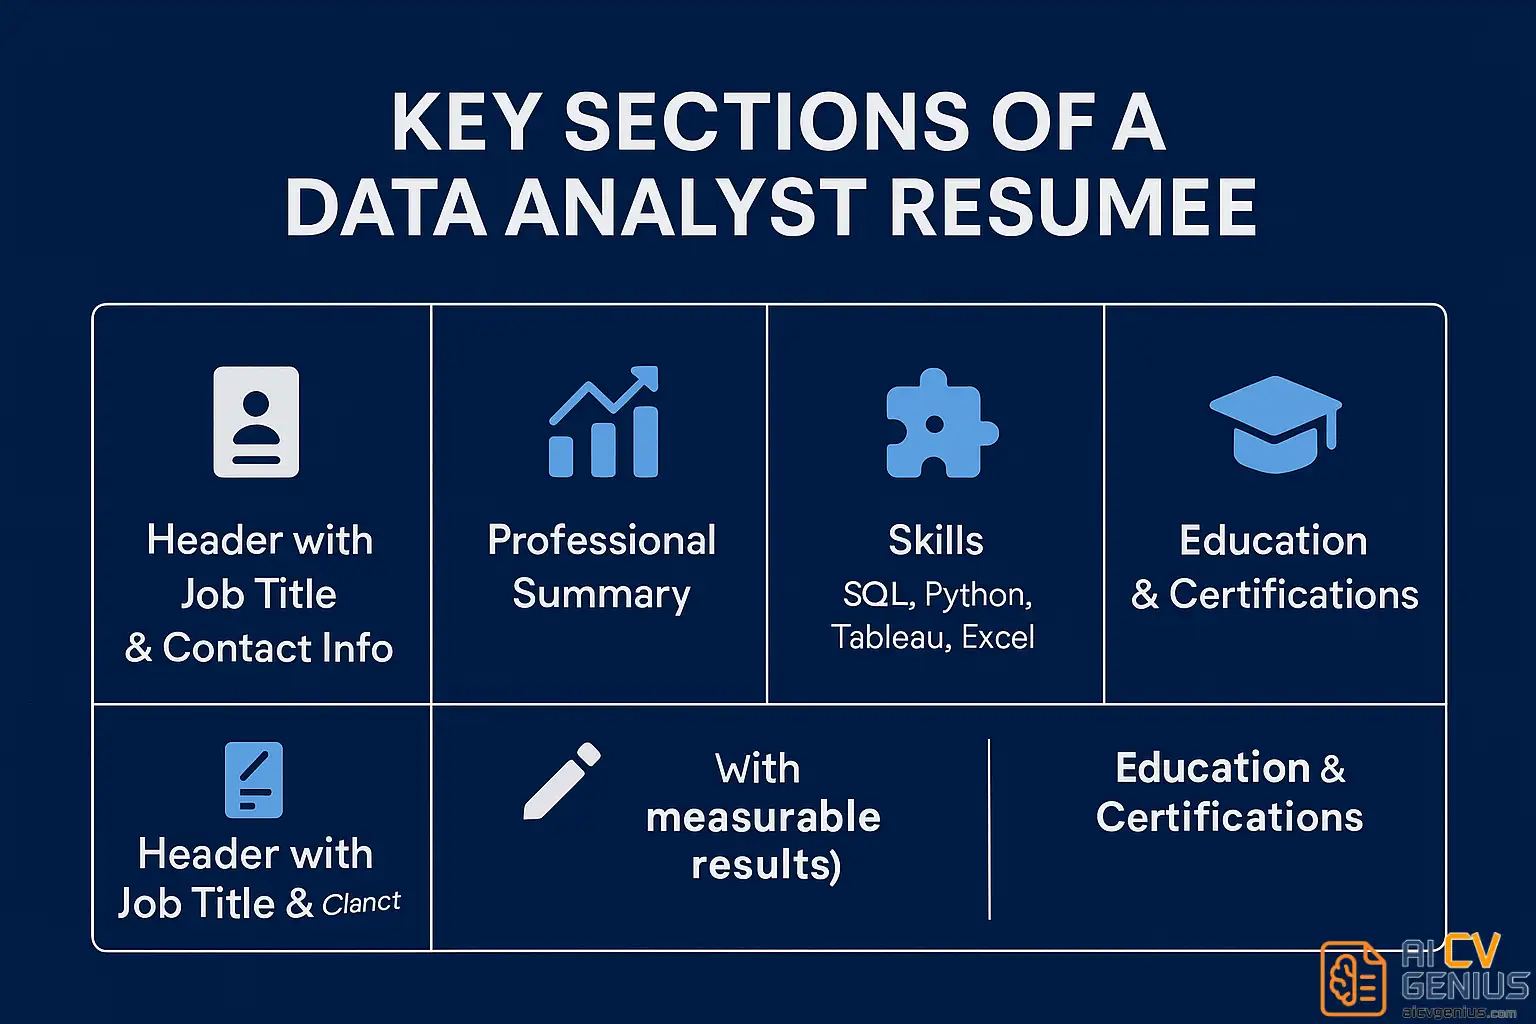
A great analyst resume flows like a clean data pipeline: Raw Data (You) → Processing (Summary) → Transformation (Experience) → Output (Dashboard/Projects). Each section validates the previous one.
1. Header: The Metadata
This must be clean and error-free. Include only what is necessary.
Your Name | Title (e.g., Data Analyst / Business Intelligence Analyst) | Location (City, State, Zip) | Email | LinkedIn URL | Portfolio Link (This is critical for analysts. Link directly to your GitHub, Tableau Public profile, or personal website with projects.)
2. Professional Summary: The Executive Dashboard
This is your “executive dashboard” – three to four lines at the top that summarize your entire resume for a time-constrained executive. It must be dense with value.
Weak Summary:
“Hard-working data analyst with experience in reports. Skilled in SQL and Excel. Looking for a new opportunity to grow.”
(This is all “what,” no “why” or “so what.”)
Strong Summary:
“Detail-oriented Data Analyst with 4+ years of experience transforming complex datasets into strategic insights. Expert in SQL, Python, and Power BI, with a proven history of automating reports and improving reporting efficiency by 35%. Eager to apply analytical and visualization skills to drive business decisions at [Company Name].”
Senior Analyst Summary:
“Senior Data Analyst with 8 years of experience leading BI initiatives. Proven ability to mentor junior analysts, manage stakeholder expectations, and deliver predictive models that reduced customer churn by 15%. Expert in Python (Pandas, Scikit-learn), SQL, and Tableau.”
3. Skills Section: The Technical Stack
Do not use this section as a “keyword dump.” Organize it logically, just as you would organize a database schema. This signals to a technical manager that you think in a structured way.
- Programming & Querying: Python (Pandas, NumPy, Scikit-learn), R, SQL (T-SQL, PostgreSQL, MySQL)
- Data Visualization: Tableau, Power BI, Excel (Advanced Dashboarding, Pivot Tables), Matplotlib
- Databases & Warehousing: BigQuery, Redshift, Snowflake, MS SQL Server, PostgreSQL
- Analytics & Statistics: A/B Testing, Regression Analysis, Cohort Analysis, Forecasting, ETL Processes
- Soft Skills: Stakeholder Management, Data Storytelling, Communication, Problem-Solving
4. Experience: The ETL (Extract, Transform, Load)
This is the most important section. You must “Extract” your responsibilities, “Transform” them into achievements, and “Load” them with metrics. Every bullet point should be an achievement.
Use the “Action Verb + Project + Metric” formula for every bullet point.
| ❌ Weak Bullet | ✅ Strong Bullet |
|---|---|
| “Responsible for weekly sales reports.” | “Automated the weekly sales reporting process using Python scripts, reducing manual reporting time by 40 hours per month.” |
| “Wrote SQL queries.” | “Optimized SQL queries and indexes, cutting query runtime by 50% and improving dashboard load times.” |
| “Worked with the marketing team.” | “Partnered with the marketing team to design and analyze A/B tests, improving campaign ROI by 18%.” |
More Strong Examples:
- ✅ Designed and launched a new Power BI dashboard visualizing real-time KPIs for the executive team, leading to faster strategic decisions.
- ✅ Performed cohort analysis on user data to identify key retention drivers, providing insights that informed a new customer onboarding strategy.
- ✅ Developed an ETL pipeline using Python and Airflow, consolidating data from three disparate sources into a central BigQuery warehouse.
5. Projects: The Portfolio (Your Secret Weapon)
For analysts, especially junior or career-changing analysts, a projects section is not optional. It is your proof of work. It shows you have hands-on skills and, more importantly, the curiosity to build things on your own. Describe each project like a mini-case study. Include a link.
Example Project Listings:
Customer Churn Prediction Model (Python, Scikit-learn, Pandas) | [GitHub Link]
Developed a logistic regression model to predict customer churn. Cleaned and preprocessed 150k+ rows of user data, engineered new features, and achieved an F1-score of 0.82. Presented findings to a mock stakeholder panel.
Sales Dashboard Automation (Tableau, SQL, Excel) | [Tableau Public Link]
Designed an interactive Tableau dashboard to visualize sales performance. Wrote SQL queries to automate data extraction from a PostgreSQL database, replacing a static weekly Excel report and providing real-time insights.
NYC Airbnb Market Analysis (Python, Matplotlib, Seaborn) | [GitHub Link]
Analyzed public Airbnb data to identify pricing drivers and neighborhood trends. Cleaned and visualized data using Pandas and Matplotlib, concluding that proximity to transit was the strongest price predictor.
6. Education & Certifications: The Foundation
Keep this section concise. List your relevant degrees (e.g., Statistics, Economics, Computer Science, Business) first. Below that, list your high-value, relevant certifications.
- Google Data Analytics Professional Certificate
- Microsoft Certified: Power BI Data Analyst Associate
- Tableau Desktop Specialist
Complete Data Analyst Resume Example (Putting It All Together)
Here is a full, one-page resume example that follows all the principles in this guide. It is designed to be clean, parsable by ATS, and compelling for a hiring manager.
ALEX CHEN
Data Analyst
San Francisco, CA 94105 | (555) 123-4567 | alex.chen@email.com | linkedin.com/in/alexchendata | github.com/alexchendata
PROFESSIONAL SUMMARY
Data Analyst with 3+ years of experience translating complex datasets into actionable business insights. Expert in SQL, Python, and Tableau, with a proven ability to automate reporting, optimize data pipelines, and present findings to non-technical stakeholders. Eager to apply analytical skills to drive efficiency and strategic decisions at [Target Company Name].
TECHNICAL SKILLS
|
|
PROFESSIONAL EXPERIENCE
Data Analyst | TechCorp Solutions | San Francisco, CA (2023 – Present)
- Automated 12 weekly and monthly business reports using Python (Pandas) and SQL, reducing manual reporting time by 20 hours per week for the sales team.
- Designed and built an interactive Tableau dashboard visualizing website traffic and user engagement KPIs, which is now used by the 10-person marketing team for daily stand-ups.
- Partnered with the product team to analyze A/B test results for a new feature launch, identifying a UI change that increased user conversion by 12%.
- Optimized database performance by rewriting legacy SQL queries, cutting average query runtime by 45% and improving dashboard refresh speeds.
Junior Data Analyst | FinStart Inc. | Boston, MA (2022 – 2023)
- Performed cohort analysis on 500k+ user records to identify drivers of customer churn, presenting findings that informed a new retention strategy.
- Cleaned and preprocessed data from multiple sources using Excel and SQL, improving data integrity for quarterly financial reports.
PROJECTS
E-commerce Sales Dashboard (Power BI, SQL) | [Portfolio Link]
- Developed an end-to-end sales dashboard for a mock e-commerce dataset of 1M+ rows. Wrote SQL queries to extract and transform data, and built interactive visualizations in Power BI to track KPIs, regional performance, and product trends.
Predictive Churn Model (Python, Pandas, Scikit-learn) | [GitHub Link]
- Built a logistic regression model to predict customer churn. Cleaned and feature-engineered the dataset, trained the model, and achieved an 84% accuracy. Documented the entire process in a Jupyter Notebook.
EDUCATION & CERTIFICATIONS
- Google Data Analytics Professional Certificate | Coursera (2022)
- Bachelor of Science in Statistics | University of California, Irvine (2021)
Refining Your Resume: Advanced Tactics and Common Pitfalls
Junior vs. Senior Analyst: Evolving The Story
Your resume’s focus must evolve with your career.
Junior Analyst / Career Changer:
- Focus: Tools, Projects, and Education.
- Strategy: Your “Projects” and “Skills” sections are your most valuable real estate. Place them high on the resume, possibly even above “Experience” if your past work is unrelated.
- Example Bullet: “Developed a sales dashboard in Tableau as part of a university capstone project; analyzed 15k+ records to identify key customer segments.”
Senior Analyst / Lead:
- Focus: Business Impact, Strategy, and Leadership.
- Strategy: Your “Experience” section is everything. Your bullets should reflect not just analysis but strategy and influence. Did you mentor anyone? Did you manage stakeholders? Did you save money?
- Example Bullet: “Led a team of 3 analysts to build and deploy a predictive inventory model, reducing stock-outs by 19% and saving an estimated $400K annually.”
The Power of Numbers: How to Quantify Your Impact
Numbers are your native language as an analyst – use them to prove your worth. “Responsible for reporting” is a vague claim. “Automated weekly sales reports, cutting turnaround time by 75%” is a verifiable fact. If you don’t have exact numbers, estimate! You are an analyst. Use your skills to create reasonable estimates. A “~25%” is better than no number at all.
Look for metrics in these areas:
- Time Saved: “Reduced manual reporting time by 10 hours/week.”
- Efficiency Gained: “Cut query runtime by 50%.”
- Accuracy Improved: “Increased data accuracy by ~25% through a new ETL cleanup process.”
- Revenue Generated / Cost Saved: “Identified a new customer segment that led to an $80K test campaign.”
- Scale Handled: “Managed a database of 5M+ user records.”
- People Influenced: “Delivered real-time dashboards used by a 15-person executive team for daily KPIs.”
Common Mistakes to Avoid (The Corrupted Files)
- ❌ Listing duties, not results: The #1 mistake. “Responsible for…” is a red flag. Start bullets with “Automated,” “Analyzed,” “Built,” “Optimized.”
- ❌ The “Kitchen Sink” Skill List: Listing every tool you’ve ever touched. This signals “beginner.” Curate your list to match the job description.
- ❌ Inconsistent Formatting: Using different date formats or misaligned bullets. For an analyst, this signals a lack of attention to detail – a fatal flaw.
- ❌ Using a Two-Column Template: We’ll say it again. It will be rejected by the ATS.
- ❌ No Portfolio Links: For a technical role, this is a missed opportunity. Show, don’t just tell.
Recommended Resume Formats
| Format | Best For | Why It Works |
|---|---|---|
| Reverse Chronological | Mid to Senior Analysts | The standard. Highlights career progression and recent impact. 99% ATS-friendly. |
| Functional | Career Changers / Freelancers | Focuses on skills and projects over titles. Warning: Many recruiters dislike this format. |
| Hybrid (Recommended) | All Levels | The best of both. Starts with a strong Skills/Summary, then a Reverse-Chronological experience. |
Tailor Your Resume: The Final Query
Use the job description as your dataset. Extract the key requirements and tools. Now, run a query on your own resume. Do those keywords appear? If the job lists “Power BI” five times and you only mention “Tableau,” you have a mismatch. Tweak your summary and skills to align with the job’s needs. This is how you beat the ATS and signal relevance to the human reviewer simultaneously. You can learn more about ATS tools and tailoring on our Reviews page.
Pros & Cons of Using a Template
| Pros | Cons |
|---|---|
| ✅ Saves time and ensures professional formatting. | ❌ Risk of looking generic if you don’t customize the content. |
| ✅ ATS-optimized structure built for analytics roles. | ❌ Some “creative” templates overuse graphics that hurt readability. |
| ✅ Helps highlight key sections with consistent visuals. | ❌ Limited flexibility if your career path is highly unconventional. |
Beyond the Resume: Your Online Presence
Modern analysts don’t stop at PDFs. Your LinkedIn profile, Tableau Public portfolio, and GitHub repositories should echo the same story. A recruiter will search for you. Make sure your LinkedIn summary matches your resume summary. Ensure your GitHub has a clean README file for your projects. If you need guidance, see Career Resources for personal branding tips.
In-Depth FAQs for Data Analysts
Final Thoughts: Your Resume is Your First Analysis
A data analyst’s job is to find the signal in the noise. Your resume should do the same. Show not just what you did, but what changed because you did it. When a recruiter reads your resume, they should see a clear pattern of impact and growth – your career’s own dataset, cleaned, analyzed, and perfectly visualized. Explore more templates on Resume Templates Finder and start building a resume that turns data into opportunity.